Snappy optimizations for faster Firefox startup
Snappy is a project that aims to improve is improving Firefox responsiveness. As part of this project I’ve been working on Firefox startup optimizations.
You can spend days, months, or even years trying to optimize code, but if you don’t understand where to optimize, you won’t be making a difference. Likewise, searching for an optimizations in a competitor’s product is usually not the best way to get results.
It’s nearly impossible to optimize code by guessing what is slow, you need to profile the code to understand the problems. Once you understand the problems you can then fix them, and then finally test to make sure they are fixed.
Here are some initial Firefox startup optimizations I’ve done with some lite profiling on Windows over the period of a few days:
- bug 724177 - 30-50ms (5%) Firefox startup speed optimization on Windows in nsLocalFileWin
- bug 724256 - Optimize move file calls on Windows, saving about 2ms per call (1 call on startup)
- bug 722225 - Firefox startup speed by ~5% (-70ms) on Windows by optimizing D3D10CreateDevice1
- bug 722315 - Firefox startup speed by by ~5% (-76ms) on Windows by lazy loading CLSID_DragDropHelper
- bug 724203 - Optimize nsLocalFile::IsDirectory on Windows by 50% giving 5ms startup improvement
- bug 724207 - Save 15-20ms on startup from unused file attributes fetch when opening files
- bug 692255 - Find a way to get rid of prefetch files on Windows for faster startup
- bug 725444 - 10-15ms main thread startup optimization in Windows AudioSession
I plan to keep doing more startup optimizations for a while in between silent update work.
So how are optimizations found? There are many ways, the first I will talk about is Xperf.
Xperf
One way to identify optimization bottlenecks on Windows is to use Xperf. Xperf is a great way to find both IO bottlenecks and CPU usage bottlenecks.
It can tell you which files use the most IO, what the IO patterns are, which functions take the most time, and allow you to group based on different criteria to view the data in different ways. It is the tool that made Windows 7 so much faster than Windows Vista. It actually does a ton more than that but I won’t focus on it in the context of this blog post.
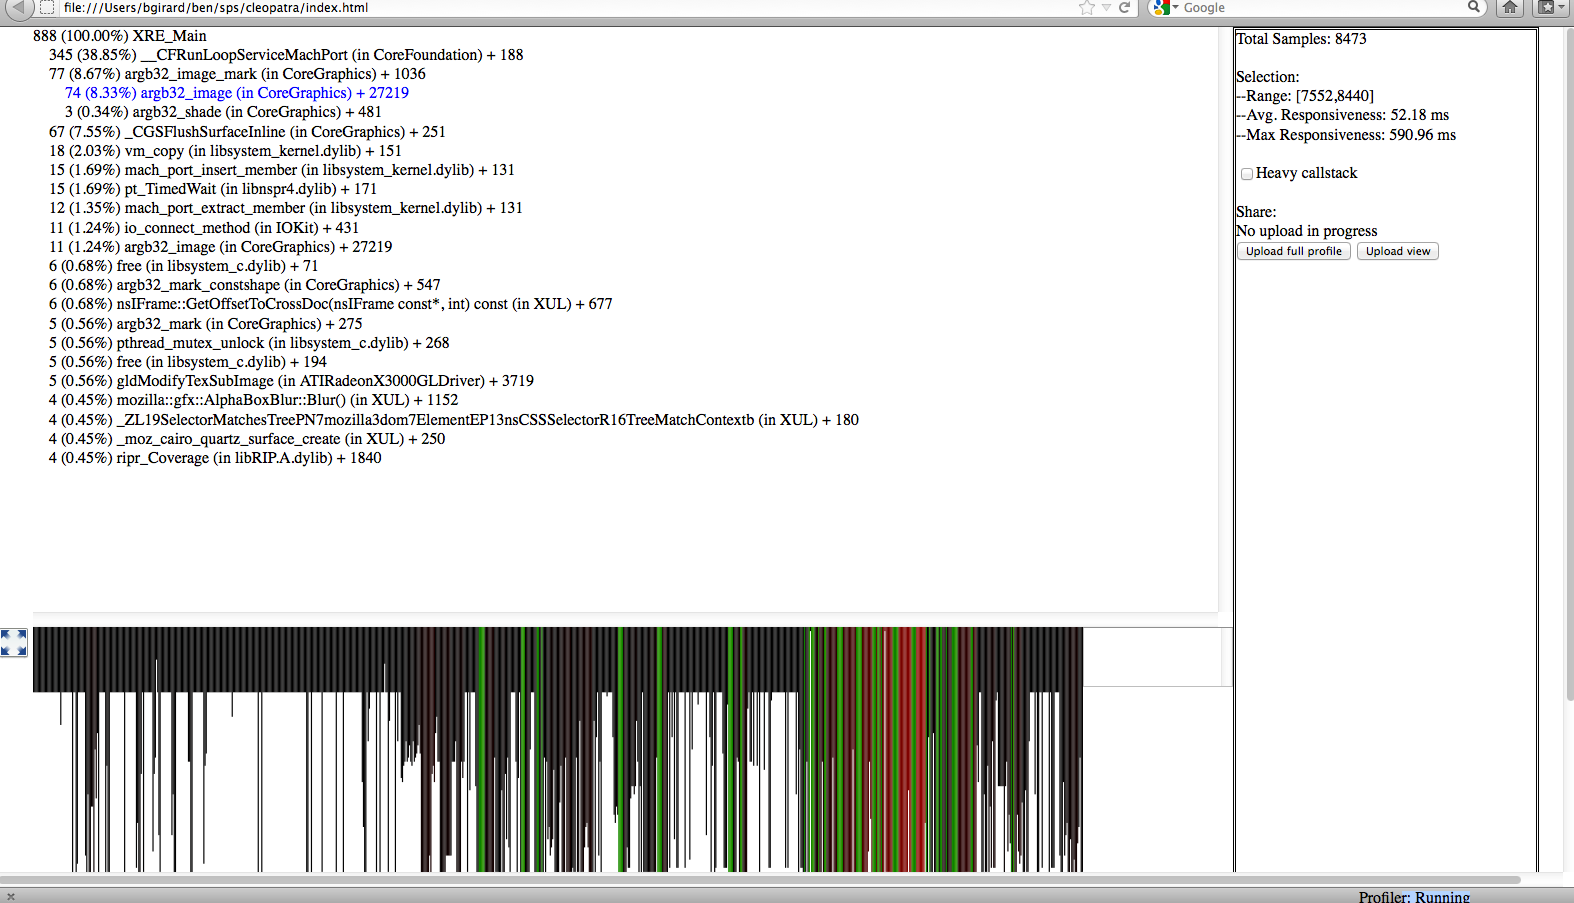
Built in Mozilla profiler
Another way to find optimizations is to use Benoit’s profiler (SPS). Currently it works well on Mac, and Windows is nearly completed.
I’m very excited to start using it on Windows.
It far surpasses the tools I’ve been using to find the bugs and fixes above.
Custom profiler
I haven’t seen how the Mozilla built-in profiler is implemented, but I suspect that this custom profiler is a simplified version of the Mozilla profiler’s Pseudostack mode.
I was able to find all of the above optimizations (with the exception of the prefetch task) with a tiny class with a couple of wrapper macros.
Basically the class is an RAII class built around the Win32 API QueryPerformanceCounter and QueryPerformanceFrequency. These functions allow you to get very detailed timing results.
For any function you want to profile you simply add the PROFILE_FUNCTION() macro to the start of the function. I usually start by adding this to each non-trivial function in a file.
Once you’ve found a function that takes a non trivial amount of time you can start to dig deeper into other functions inside of the function until you find the root cause.
But sometimes a function has a lot of code and you aren’t sure what the slow part of the function is. For this I use a second macro PROFILE_STR(“FunctionName:N”) where N is a number I increment evenly spaced out. The string can be anything, I just use that normally.
These macros just create an object. The constructor of the object stores the start time, the destructor of the object gets the end time.
The destructor also uses the function name or string as a lookup in a global map that keeps track of the number of hits, the maximum length of time, the minimum length of time, and the average length of time for each function/string.
There is a third macro I was using to dump the results to a file at particular events I wanted to focus on, like first paint, or when the session is restored.
One thing you have to look out for with this method is if you happen to put the calls in a recursive function.
In that case it will appear to be a bigger bottleneck because the first call will include the full length of time of all calls that contain it.
All of the inner calls will add onto that.
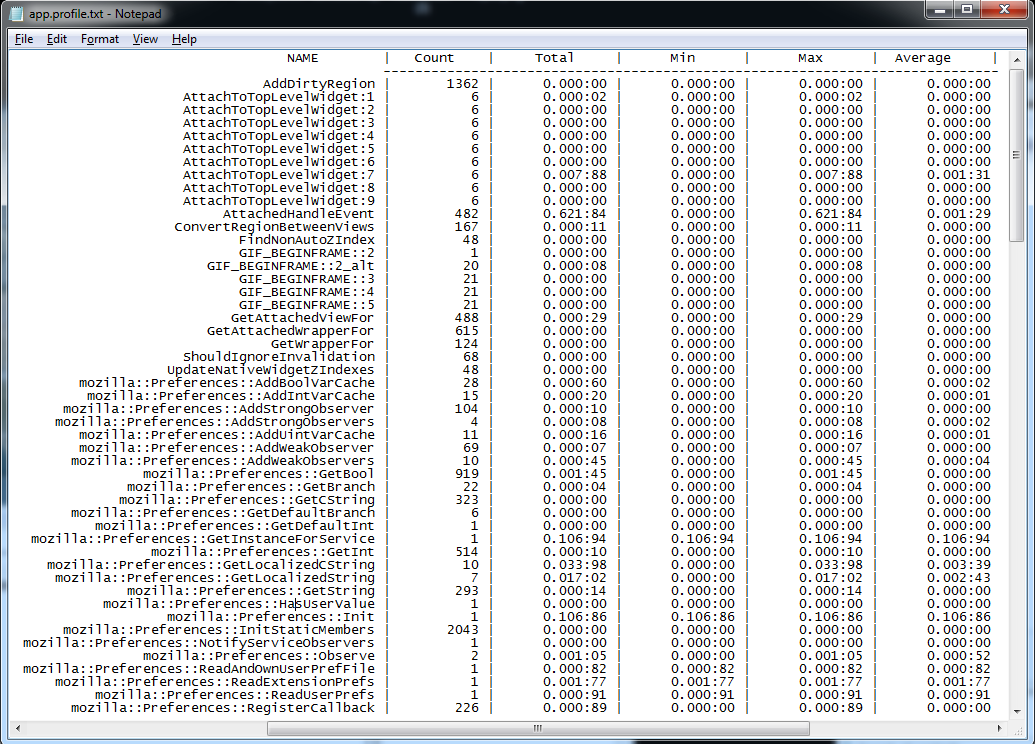
The output of this function is made when the third macro to dump the results is called. It dumps the results to a simple formatted .txt file:
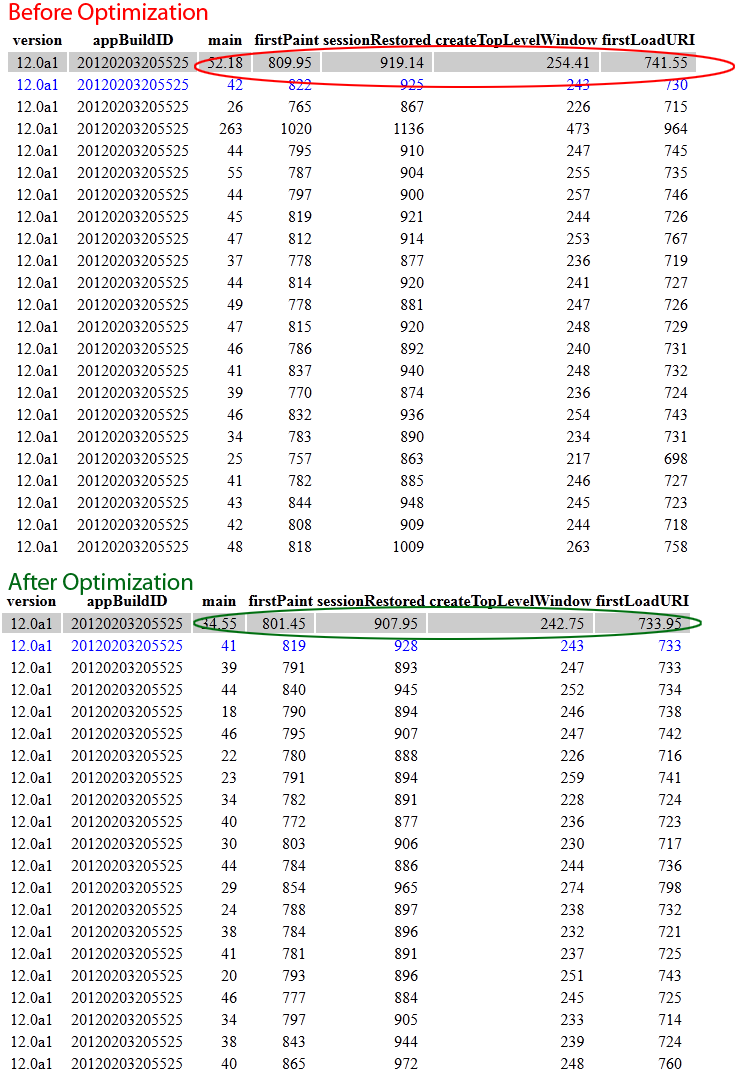
Verifying startup results
If you’re working on Firefox, a good way to verify that your speed optimization made a difference is to use the about:startup extension.
This extension times the startup of important events like firstPaint and sessionRestored and gives you the average up top.
To verify my results I just did 20 startups in sequence with a release build that contained my patches vs a release build that did not contain my patches.
Here is an example after one of the patches above: